Paid Social vs Google Ads: When to Use Which
Compare paid social and Google Ads by intent, funnel stage, and commercial outcome. Choose the right mix for your goals.
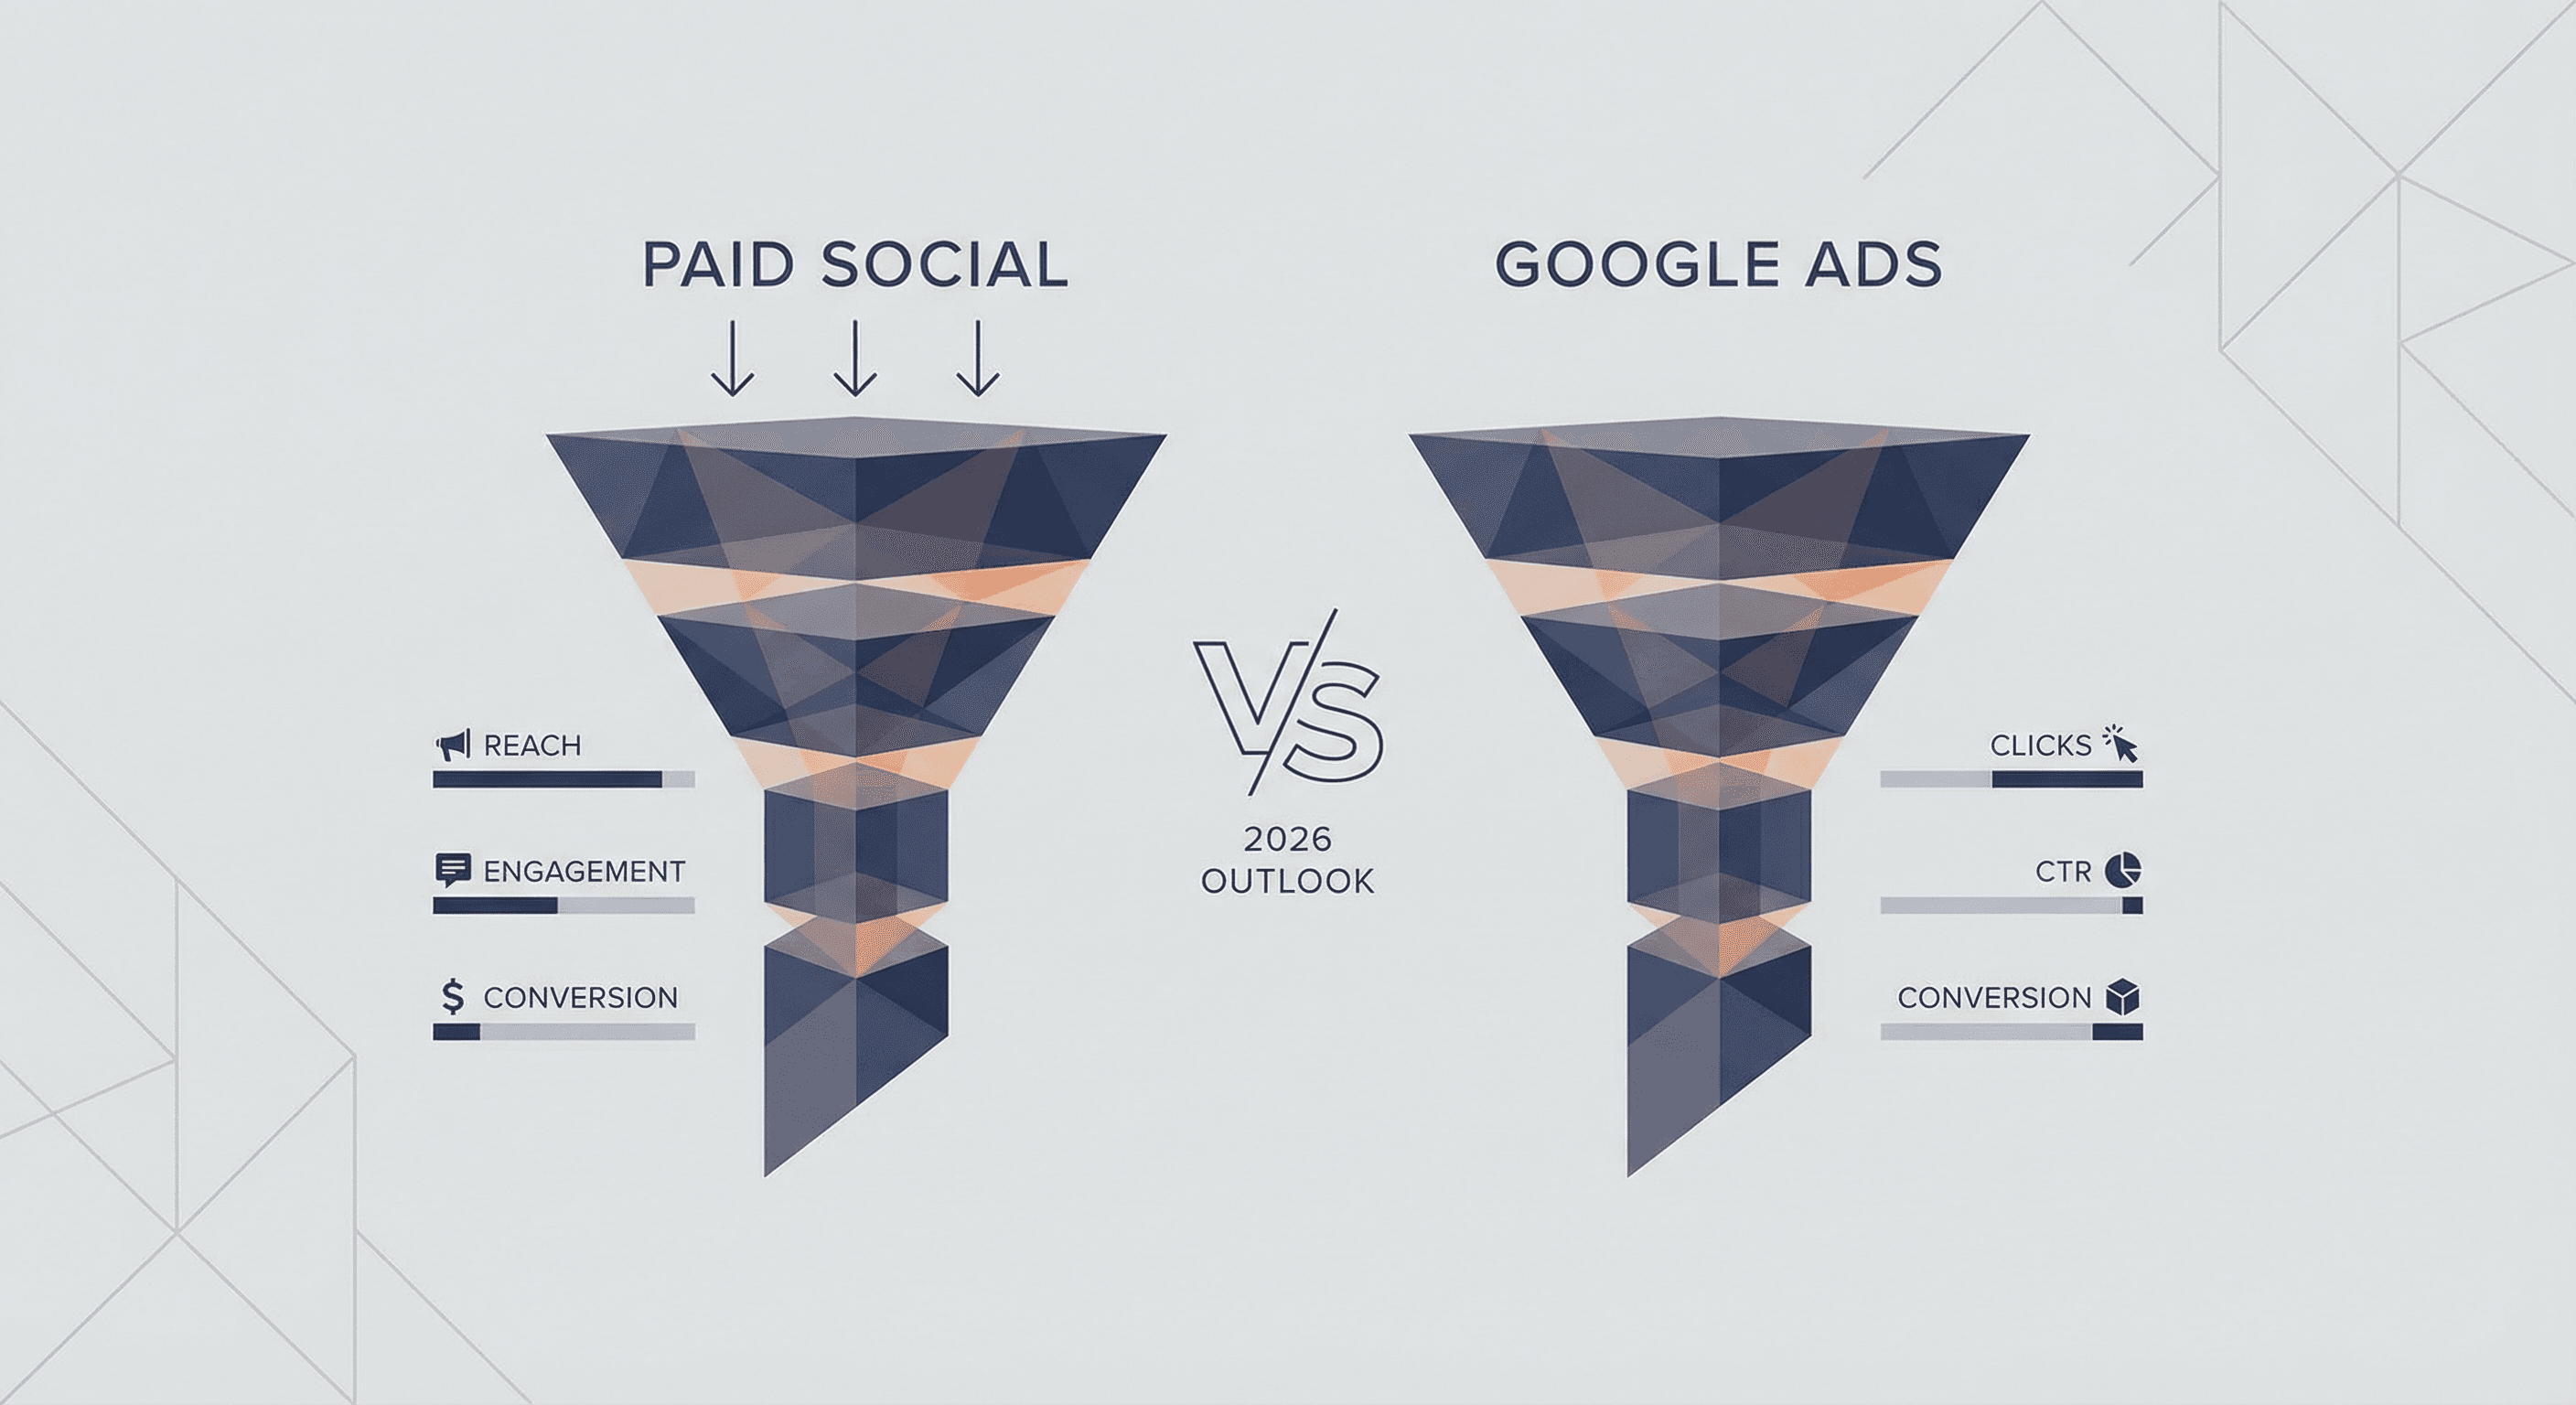
Paid social and Google Ads serve different parts of the funnel. Choosing one over the other by default wastes budget; the right mix depends on intent, product, and commercial goals.
This guide helps you decide allocation and when to lean on each channel.
Intent and Funnel Fit
- Google Ads (Search) captures high-intent, active demand.
- Users are searching for a solution; your ad meets that moment.
- Paid social (Meta, LinkedIn, etc.
- ) is largely demand creation: you interrupt with content and retarget.
Use search for bottom-funnel conversion and retargeting; use social for awareness, consideration, and lookalike expansion.
Channel Comparison
| Dimension | Google Ads (Search) | Paid Social |
|---|---|---|
| Intent | High (user-initiated) | Lower (ad-initiated) |
| Best for | Leads, sales, local actions | Awareness, consideration, retargeting |
| Attribution | Often last-click clear | Multi-touch, assisted |
| Creative need | Text and simple assets | Strong creative and iteration |
Budget Allocation Heuristics
Avoid splitting budget evenly without defining each channel’s job. Role clarity improves measurement and optimization.
- If lead quality and volume are the goal: start with search, then add social for retargeting and lookalikes.
- If brand and consideration matter: invest in social first, then search to capture branded and category demand.
- If both matter: run both with clear role definitions and shared attribution view.
Measurement and Governance
Use a single attribution view (or at least a consistent model) across both. Report by channel role: search for conversion, social for assisted and reach.
Review mix quarterly; shift budget when one channel’s marginal return drops or the business goal shifts.
Decision Model for Growth Teams
Most PAID initiatives fail because strategy and execution decisions are mixed without one evaluation model. Teams ship activity, but they do not rank initiatives by impact, speed-to-value, and operational cost.
A practical decision model fixes this: score each initiative by commercial impact, implementation effort, and governance complexity. If impact is low and maintenance cost is high, it should not enter the sprint backlog even if it looks attractive on paper.
- Priority 1: highest impact on qualified demand and conversion quality.
- Priority 2: initiatives that improve process reliability and data trust.
- Priority 3: controlled experiments with explicit success criteria.
30/60/90-Day Execution Blueprint
Days 1-30 focus on diagnosis and baseline: data hygiene, intent mapping, KPI baselines, and bottleneck discovery. The objective is not volume of output; it is removal of friction that suppresses performance.
Days 31-60 prioritize highest-leverage deployment on templates and channels with strongest commercial impact. Days 61-90 institutionalize iteration, ownership, and reporting cadence so results are repeatable rather than campaign-dependent.
- Days 1-30: audit, baseline KPIs, decision priorities.
- Days 31-60: deploy highest-leverage changes.
- Days 61-90: iterate on data, codify governance, scale.
Baseline
Deployment
Iteration
Scale
KPI Governance and Accountability
Your KPI stack should connect visibility, behavior quality, and business outcomes in one causal chain. If reporting stops at top-of-funnel metrics, teams optimize activity rather than commercial impact.
Every KPI needs an owner, target range, and review cadence. Ownership is what turns dashboards into decision systems.
| Layer | Operational KPI | Business KPI |
|---|---|---|
| Visibility | coverage, CTR, index quality | share of qualified demand |
| Traffic quality | engagement, assisted actions | lead quality / SQL ratio |
| Commercial outcome | execution cost and cycle time | pipeline, revenue, payback |
Risk Register and Mitigation
Common growth risks are channel-message mismatch, unresolved technical debt, and misaligned definitions between marketing and sales. These failures often erase gains from otherwise solid strategy.
Maintain a risk register with early signal, owner, intervention threshold, and mitigation action. This governance artifact reduces reaction time and protects compounding performance.
Sustained growth is a governance outcome: repeatable decisions outperform one-off tactical wins.
SEO-AIO-GEO Readiness Before Scaling
Before increasing volume, validate three layers: SEO (intent fit and technical integrity), AIO (answer-first structure and citation readiness), and GEO (entity consistency and local context where relevant).
Content should provide direct executive-grade answers, operational frameworks, and measurable KPIs. This raises utility for users and improves citation potential in AI-generated discovery surfaces.
- SEO: intent alignment, information architecture, technical stability.
- AIO: direct answers, procedural structure, entity clarity and evidence.
- GEO: local context, entity consistency, trust and reputation signals.
Quarterly Execution Loop: Delivery, Measurement, Iteration
To maintain both quality and growth velocity, run a quarterly operating loop: performance review, priority reset, and focused upgrades on sections with highest pipeline relevance. This reduces random editorial drift and improves commercial predictability.
A practical operating model is one cluster document with quarterly objectives, ownership, KPI targets, risk log, and iteration backlog. It aligns content, SEO, and growth teams around one outcome language instead of disconnected reporting layers.
- Monthly: refresh evidence and decision-critical sections.
- Quarterly: recalibrate executive question map and internal linking.
- Post-iteration: evaluate lead-quality and pipeline impact deltas.
| Horizon | Action | Target Outcome |
|---|---|---|
| Monthly | content and entity-signal refresh | stable visibility quality |
| Quarterly | topic re-prioritization | stronger intent-to-revenue alignment |
| Half-year | architecture and governance audit | higher commercial predictability |
Execution Ownership and Delivery Precision (1)
For "Paid Social vs Google Ads: Decision Guide", implementation quality improves when ownership is defined at weekly action level, not only quarterly targets. Without operational ownership, strategy quality rarely translates into stable outcomes.
Use a simple format per initiative: owner, deadline, KPI, and acceptance condition. This reduces decision latency and protects execution consistency.
Process Quality Metrics (2)
Beyond outcome KPIs, track execution process quality: cycle time, number of iterations to acceptance, and performance stability after 30/60 days.
This helps distinguish temporary uplifts from durable improvements and sharpens next-cycle prioritization.
- decision-to-deployment cycle time
- first-cycle execution quality
- post-release stability of outcomes
Operational Risk Controls (3)
Common execution risks include priority misalignment, data inconsistency, and publication delays. Each risk should have an owner and an explicit mitigation trigger.
A lightweight risk register with thresholds often improves decision quality faster than adding new tools.
Quarterly SEO-AIO-GEO Iteration Layer (4)
At the end of each quarter, refresh high-intent sections, update evidence blocks, and tighten decision-focused answers. This keeps content citation-ready and commercially useful.
Consistent iteration protects topical authority while improving predictability of pipeline impact over time.
Execution Ownership and Delivery Precision (5)
For "Paid Social vs Google Ads: Decision Guide", implementation quality improves when ownership is defined at weekly action level, not only quarterly targets. Without operational ownership, strategy quality rarely translates into stable outcomes.
Use a simple format per initiative: owner, deadline, KPI, and acceptance condition. This reduces decision latency and protects execution consistency.
Paid social and Google Ads are complementary. Define each channel’s role, measure with one lens, and adjust the mix as goals and performance evolve.
Need a paid channel strategy that fits your funnel? We can design allocation and measurement.
Book a strategy consultationFrequently asked questions
Should we use both from day one?
Often start with one (usually search for direct response) and add the other when you have conversion volume and creative to test.
Which is better for B2B?
Both can work. Search for high-intent terms; LinkedIn for targeting and thought leadership. Match creative and offer to platform.
How do we attribute across channels?
Use a single attribution model (e.g. data-driven or linear) and report assisted conversions so social gets credit where it helps.
When should we reduce one channel?
When marginal CAC or cost per outcome rises above target, or when the channel’s role is no longer aligned with current goals.